StockFries Knowledge Base
A collection of investing basics and portfolio strategies
Picking Stocks is Gambling
2020-09-02 | General
Who Are You Betting Against?
The amateur investor (i.e. anyone who's not paid to do it) develops their portfolio of stocks in the same manner that they would bet at the poker table. In tournament poker you have metics like ICM and EV to guide you; however, you are in the end making a bet with imperfect information. In the investing world, however, the important thing to remeber is that on the other end of your limit order on Robinhood or Schwab is someone else making the opposite bet as you; and it could be someone who is paid to do it who has a lot more tools than you do.
Are You a Weak Thinker?
And then there is the matter of the Efficient Market Hypthosis (EMH) which states that "It's All In The Price!" That is to say, that there are three ways to interpret the price of an asset or securtiy:
- The strong form of the EMH: You can't beat the market because the price of an asset is the exact value of what it is worth. All information—both the information available to the public and any information not publicly known—is completely accounted for. "It's all in the price!"
- The semi-strong form of the EMH: The market is a random walk and the price of an asset doesn't reflect its worth. Thus, you can beat the market by using standard fundmanetal evaluation metrics
- The weak form of the EMH: The market is a random walk and the price of an asset doesn't reflect its worth. Thus, you can beat the market by using standard fundmanetal evaluation metrics.
If you're here and/or picking individual stocks you're a Semi-Strong or Weak form of the EMH.
What's the Point of this Site?
This website is designed to provide information. We're just scraping 50 publically available 13-HR quarterly filings from the SEC and then aggregating them together. We don't want to recommend securities or get you behind a paywall like Motley Fool or Whale Wisdom. We just want to provied a quick data point for all those gamblers out there.
After all, picking stocks, like french fries or gambling, is awfully addicting. 🍟
Investing Basics Part 1/2 – Individual Security Metrics
2020-10-05 | General
Metrics
Returns = (cash_flow) + (capitatl_gains)
If you buy some Tesla stock—like most Hedge Funds are doing—you make money when (1) they pay you Dividens or (2) you sell that stock at higer price
Risk = (violitility / varitaion_of_returns)
Violitility depends on (1) Credit Default Risk and (2) Liquiditty of Investments. That is, a Bond issued by the government of Argentina is exremely liquid or tradeable but might default
Types of Investments (Asset Classes)
↑↑↑ HIGHEST RISK ↑↑↑
- Derrivatives: Mortgage Back Securities, Credit Defaultt Swaps, Speculations, Hedging
- Equities ($100T WW): Stocks and Stonks; these are risky investments.
- Alternative Investments: Forestry, Art, Gems
- Bonds ($200T WW): ixed Income, Credit Markets, Debt Markets, Instrumenst
- Cash: Bank Depositst or Certificates of Deposit (CODs)
↓↓↓ LOWEST RISK ↓↓↓
Modern Portfolio Theory
A Two Step Process:
- Asset Allocation: Figure out what your class breakdown of different investment classes will be
- Security Selection:
- Active portfolio management (e.g. picking stocks)
- Passive portfolio management (e.g. mutual funds)
If you're here and/or picking individual stocks you're Probably a 2.A kind of person. The 2.B kind of people are Strong EMT thinkers and will say "just invest in mutual funds, no one can beat the market." However, there are some people who do beat the market
Investing Basics Part 2/2 – Portfolio Metrics
2020-11-01 | General
Portfolio Return
In our last post, we covered how to calculate the expected return E(ra) of an asset. The Return of a Portfolio rp or a group of assets is the sum of the returns of each asset times the weight of each asset's holding.
rp = Σ ws * rs
ws = the weight of the security in the portfolio
E(rs) = the expected return of that security
Portfolio Risk
In previous post we reviewed how we calculate the risk of an asset which is simply the standard deviation of the possible returns.
Modern Portfolio Theory
Risk = σ = √{ Σ(ps * [ Es - rs ]2) }
s = the stock or asset or securiy given a certain state
ps = the probabiliy of the state
Es = the expected return of all states
rs = the expected reurn of that specific state
Some Companies do better in down markets:(1) Precious Metals, (2) Certain Insruance Companies and Hedge Funds, and Forclosure Experts and Report Agencies
This is why you can't look at stocks individually. Rather, you have to look at how they move in relation to each other. The Risk of a portfolio depends on the correlation of the returns. For example, a portfolio made of primarily of tech companies will have a greater risk--a greater standard deviation of returns--because they all go up and down under similar market conditions.
Covariace: Σ { ps * [ras-E(ra)] * [rbs-E(rs)] }
Correlation: ρa,b = (covariance(ra,rb) ) / (σa * σb)
Covariace: ρa,b * σa * σb
The risk of a two asset portfolio can then be written as:
σp2 = wd2* σd2 + we2* σe2 + 2*wd*we * covariance(rd, re)
σp2 = wd2* σd2 + we2* σe2 + 2*wd*we * ρa,b * σa * σb
Diversification By Example
Suppose we have a two evenly weighted stock portfolio: 50% in Telsa and 50% in Boeing (the two heaviest holdings on StockFries righ know). Let's calculate the expected return (E(rp)) and the risk (σp) of this portfolio:
E(rt) = Expected Return of Tesla = 10%
E(rb) = Expected return of Boeing = 5%
σt = Standard Deviation of Returns of Telsa = Risk = 15%
σb = Standard Deviation of Returns of Boeing = Risk 10%
ρt,b = Correlation Coefficient of Boeing and Tesla = -0.5
wt = Weight of Tesla = 50%, wb = 50%
What is the expected return of this two securit portfolio?
E(rp) = wt * E(rt) + wb * E(rb)
E(rp) = 0.5*0.1 + 0.5*.05 = 7.5%
This is what we would expect (7.5% is halfway between 10 and 5)
What is the risk or standard deviation of returns of this portfolio?
σp = √{ wt2 * σt2 + wb2 * σb2 + 2*wt*wb * ρt,b * σt * σb }
σp = √{ (0.52*0.152 + 0.52*0.12 + 2*0.5*0.5*(-0.5)*0.15*0.1) }
σp = √{ (0.005625 + 0.0025 - 0.00375) }= 6.6%
Wow, the risk drops way more than 50%!
That's power of diversification; your risk drops faster than your expected value...assuming you can find stocks with negative covariance or correlation of returns.
Portfolio Creation Prt 1/3 – Picking Assets
2020-12-08 | General
Where to Start
So you've got some money and want to invest it. If you don't want to play it safe and just pick some mutual funds then your first step is to decide on a trading strategy and then pick posiions with negative covariance. The best way to understand the different strategies imployed by the world's biggest hedge funds is to identify: (1) the oppurtunity set (equities, fixed income, and futures/fx) and (2) strategy employed.
Where to Start
Equities
- Long/Short: Pick stocks using fundamental investing techniques. Typically value-investors or GARP by nature holding concentrated portfolios. Attempts to gain “better” information advantage about portfolio companies. With deep-dives into company’s earnings quality/management quality/business prospects. Many times long/short managers will focus on specific sectors. eg. Tiger and Tiger clubs, Buffett-clones, Activists, T2, Ichan, Einhorn
- Short-Biased: Betting against stocks that are considered fundamentally “bad.” Managers attempt to profit by shorting weak companies. These hedge fund managers attempt to identify corporate frauds, to examine forensic accounting issues and flaws with business model e.g. Island Drive, Kingsford, Jim Chanos of Kynikos
- Equity Market Neutral: “Quants” incorporate, value, B/M, P/E; size; momentum; reversals; convergence trades, pairs trading; statistical arb; high frequency trading; index arbitrage, eg. Bogle, BGI32, Symphony, O’Connor, Univ of Chicago PhDs, Fama’s students
- Event Driven: Betting on specific corporate or geo-political events. “Special situations” investors attempting to capitalize on corporate events such as a merger, corporate restructuring, liquidation, bankruptcy, etc. Mergers: cash deals, stock-for-stock, stock and/or cash, collars; spin-offs; stubs; distressed securities, bankruptcy, when-issued; IPOs; SPACs, eg. Paulson, Donatello, Farallon
- Emerging Markets: Long/Short/Fixed Income with local market expertise, typically stock selection and hedge with liquid instruments, country selection, currencies, eg. Boyer Allan, Everest, LIM, SPARX, (BRIC, Mark Mobias)
Fixed Income
- Fixed Income Arbitrage: Trade the yield curve, or credit curve. Managers attempt to gain edge by trading predominantly fixed income securities such as interest rate swap arbitrage, US/non-US gov't bond arbitrage, forward yield curve arbitrage, yield curve behaviors, butterfly; mortgage backed securities arbitrage; CDS-bond basis; on-the-run/off-the-run, eg. Long-Term Capital, Oakhill, Ellington, III, MKP, PIMCO
- Convertible Arbitrage: Typical trade includes long converts, hedge equity and/or credit, fixed income; flip newly issued convert, gamma, busted, high-money, e.g. Citadel, Canyon, CQS, Nisswa, Quattro, Wolverine, Zazove
FX / Futures
- Global Macro: Trade discretionary across global liquid markets. Discretionary trading, trade in anticipation of global macro shifts, carry-trade (uncovered interest rate parity); devaluation; thematic; global yield curves; monetary/fiscal policies, macro economics, real rates across countries; tactical asset allocation, eg. Soros, Brevan-Howard, Pantera
- Managed Futures / Systemaic CTAs: Trade systematic across global liquid markets. Trend-followers, countertrends, overextended trends, as well as concentrated fundamentals, eg. Aspect, BlueTrend, Campbell, Crabel, Graham, AHL Man, Sunrise, AHL, Winton, Millburn, MLM, Quadriga, Rotella, Roy G. Niderhoffer, RQSI, Sunrise, Transtrend
Multi-Strategy
- Multi-Strat: Combines several hedge fund strategies and attempts to rotate across strategies, eg. GLG, Concordia, Highbridge, DE Shaw, TPG, OZ
- Fund of Funds: Invests in a portfolio of hedge funds, eg. Rock Creek, PAAMCO, UBP, Glenwood
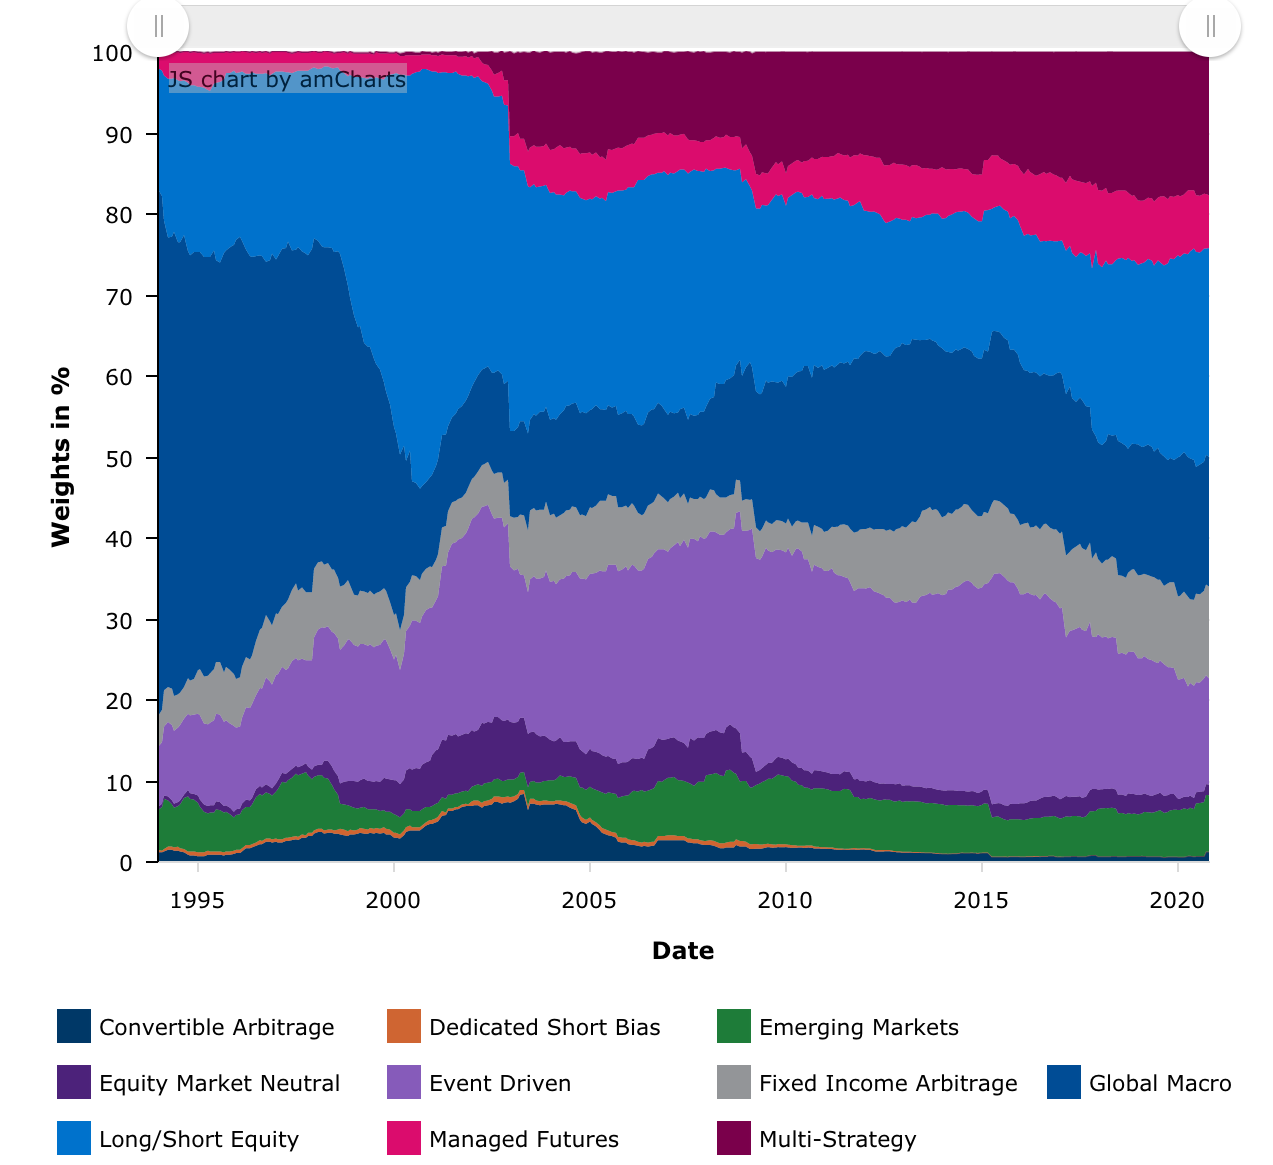
Strategies over time
From the Credit Suisse Hedge Fund Index. The 90's clearly were the golden age of Global Macro.
That's interesing and all, but what am I supposed to do?
So you're ready to start investing-gambling; how fun! Follow these steps to feign the idea of investment theory: (1) Choose a trading srategy (most will pick "Long/Short" or "Multi-Strat") (2) Find some assets with negative covariance. If you're looking for Long/Short ideas, then why not start with Stock Fries?
After we find what we want to bet on, its time to figure out how to split up the money in our next blog post: Portfolio Creation Part 2: Spliting Up the Money.